TOP > News & Articles > Research Highlight > Database integration accelerates data-driven quantitative biology

Database integration accelerates data-driven quantitative biology
On a small island stands a large laboratory complex. Inside one of the laboratories you find glassware, dishes, and lifeforms in incubators. There are dark rooms, laser beams and lots of heavy weight microscopes. Large glass doors separate labs and in an air-tight isolation room, you find an automated data acquisition system. There is a huge server computer room with security controlled access. A computer display shows a movie of a developing fertilized egg. Others show computer simulations of cell division.
Is this an imaginary lab that performs secret studies on unknown life forms? Is this an undisclosed location in the Arctic?
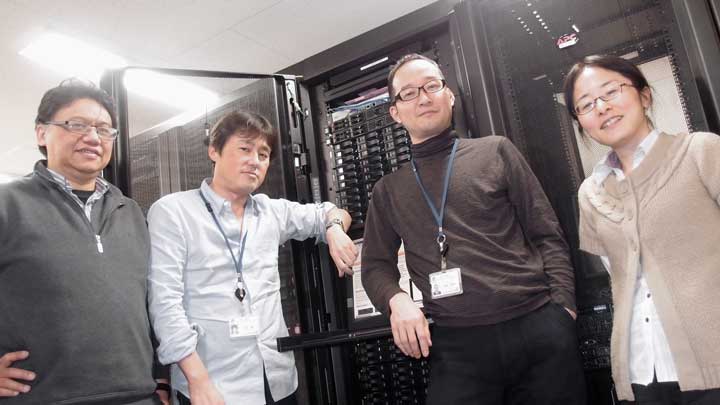
In the lab you meet Koji Kyoda. He reassures you that you are on the Port Island in Kobe, Japan, which enjoys mild winters. And you are in QBiC's Laboratory for Developmental Dynamics nestled in one of the RIKEN Center for Developmental Biology buildings. The fertilized egg on the display is that of a well-known research animal, the nematode worm called C. elegans.
The adult C. elegans worm is approximately 1 mm length and composed of about 1,000 cells. In the 1970s, all cell divisions of the animal were observed under the microscope and recorded as handwritten notes. At that time, researchers recorded which cell divided from which and thereby tracked all cell divisions and cell lineages, from one fertilized egg through maturation.
Today a large number of images is automatically taken in serial focal planes and recorded on a hard disk of a computer directly connected to the microscope. Three-dimensional (3D) images are reconstructed by superposing these images of the serial focal planes. Furthermore it is possible to record the process of cell division by acquiring 3D images at regular time intervals. Such a system is called 4D microscope.
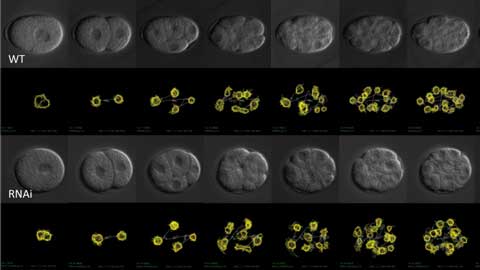
Time-series images of cell division of nematode C. elegans taken by 4D microscopy. The position and movement of the nucleus (yellow line) had been extracted by image analysis. A normal embryo (WT, upper half) was compared with an embryo in which the function of a specific gene was inhibited by a process called RNAi (lower half).
Kyoda and his colleagues have performed detailed analysis of cell division dynamics using 4D microscopy for various embryos. Sometimes gene functions are suppressed in the embryos by a technique called RNA interference (Figure 1). The series of time-lapse images of the embryo projected on the computer screen track the changes in shape and position of each nucleus at every moment. The computer extracted the contour and position of the nuclei and saved them as numerical data. Accurate and highly objective data can be obtained and the speed of acquisition is dramatically improved. Thanks to the exponential increase of computer memory and processor speed, large dataset analysis in biology has become more common and the speed of data accumulation is accelerating all the time. With these advances come new challenges and new solutions.
Kyoda has been involved in both the biological experiments and the information processing of this project. He is a research scientist who has been working with Shuichi Onami since he was a graduate student. Onami, the team leader of the lab, is interested in revealing the secrets of life but he is pursuing it QBiC style, which is to predict life by calculation. The idea percolated when he was searching for his own project after finishing his PhD training. He has maintained the same research theme ever since and with his own lab established in RIKEN, this became one of the main projects.
The problem of the database sharing
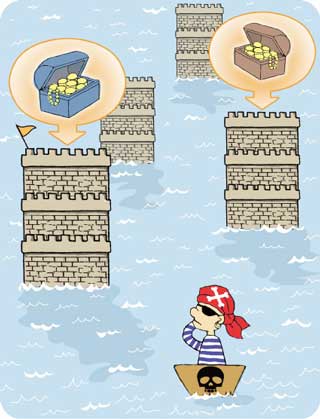
There are numerous publicly available databases but accessing them is not always easy.
Large data sets are stored in databases. In biology there are various kinds of databases including genome, transcriptome, proteome and metabolome databases, and many more. These provide comprehensive large-scale datasets on the identity and frequency of molecules in certain tissues or pathological states. The data can represent the average value or a snapshot of the state of the organism. Meanwhile, many QBiC researchers are interested in acquiring the data of spatiotemporal changes of individual elements. For example, changes in the localization of molecules or the morphology of organelles during changes in the cell state, as well as the time lapse images of cell divisions or the movement of cells during animal development are of particular interest. Databases containing such data types are expanding and getting more attention by researchers who aim to predict molecular and cellular behaviors.
Most of such databases are publicly available, and while the amount of data produced by one researcher is limited, the databases can be used by other researchers in various analyses, e.g. comparative analysis. But Kyoda pointed out that there is a big barrier.
"Everybody knows data sharing is pivotal for research and the development of a scientific field. But in reality, it is common that a data format is determined on a per-project basis. In other words, even if the two research groups carried out similar projects, they often have adopted an entirely different data format. If this happens comparing the data isn’t easy at all. "
Experimental scientists tend to choose easy-to-use tools for their research. Kyoda himself constructed his databases by using, for example, a collection of connected line segments to express a shape of nucleus. On the other hand, an American group is using the sphere as a form to express the nucleus.
"I run into various problems in data format. There are some famous publicly available databases but I found it’s not easy to even see the contents."
Since the data is merely a series of numbers recorded on a hard disk, software tools for data visualization are used to understand and interpret the numerical data. However in many of currently available databases the data cannot be recognized by generic visualization tools. They can be visualized only by their own software bundle. This is inconvenient for researchers who would like to compare datasets from different databases.
To make a data format that all researchers can use
Increasing numbers of laboratories worldwide have started studies to predict biological phenomena using a systems biology approach. Data describing the dynamics of the component parts are accumulated in such studies but as the field is still young, a common data format has not been established. Kyoda and his colleagues have embarked on standardizing the data format. They named the new format Biological Dynamics Markup Language (BDML) and published it recently in Bioinformatics [1].
There are three main features in BDML. First, the format is based on the Extensible Markup Language (XML). The XML format is a text based format. It is a format that surrounds all of the information by the tag that represents the meaning and structure of information. The advantage of XML is that the meaning of the data is easy to understand not only for the computer, but even for humans. XML formats are used, for example, in common bibliography database such as PubMed, and for communication between various applications. Moreover, the html documents that make up websites are also derived from the XML format.
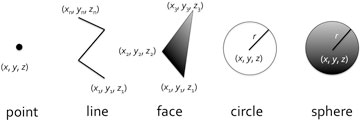
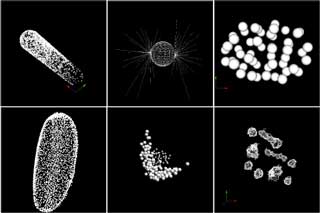
The second main feature is that it normalizes the representation of spatial information. As the minimum elements in BDML, points, continuous line segments, triangles (representing a surface), circles and spheres are available (Fig. 3). By the combination of these elements it is possible to cope with almost all the existing data formats. Of course, it's possible to add a new element in the future, if necessary, as the BDML is extensible.
Lastly the BDML accommodates so-called metadata such as the origins of data and experimental conditions. Only when such information is available can researchers understand the relationship between data with different origins. To store metadata in a searchable form, the computer representation of the metadata was standardized and expressed by combinations of subject, predicate, and object. To avoid further ambiguity, all terms were defined in ontology databases that assign unique ID to the terms. This is a collection of terms used to systematically organize the concepts for a specific field. For biology, for example, there is a database called Gene Ontology.
Data that is written in BDML are registered in Systems Science of Biological Dynamics (SSBD) database (http://ssbd.qbic.riken.jp) that is hosted by the Onami lab. Anyone can access the SSBD database via the web, and search and retrieve data in BDML format (Fig. 4).
The future of Biology: Data analysis tools and machine learning
There are various software tools for data analysis but there are very few that can be used in common among multiple databases. A software tool that can handle BDML format could analyze the data of all databases that conform to the BDML. The benefits of this tool would be immeasurable and the Onami lab is tackling this challenge too. First, Kyoda and colleagues developed BDML compatible plugins for publicly available visualization tools such as imageJ and for some other general purpose analysis tools. They are also developing new analysis tools for BDML. The programs will be deposited to SSBD and available to everyone (http://ssbd.qbic.riken.jp/download/). At the same time, they are developing programs to convert the data in the various existing formats to the BDML format. These converted data will be shared in SSBD (Figure 5). Once all of these tasks have been completed researchers will be able to access freely through SSBD the data that were scattered in multiple databases and conduct comparative analyses.

"We made a long detour, so to speak" says Yukako Tohsato, a research scientist in the lab and co-author of the paper. She originally studied artificial intelligence in graduate school. After working for a private company for a while she returned to the world of large scale data analysis in biology and biological simulation. While involved in system design of SSDB in cooperation with Kenneth Ho who has much experience in system development, she is also working on developing new analysis software.
Her intention is to apply machine learning techniques to analysis of large scale biological data. Now that BDML standardization is underway, it will be possible to handle a wide variety of data at the same time. One can analyze not just data from multiple species but also multi-level data such as molecular, cellular, and individual organism level data at the same time. These datasets are so huge and diverse that human intuition is no longer practical for ascertaining their meaning. This is where machine learning comes in.
The biggest challenge in modern biology is to extract meaningful information from a vast amounts of data. If we don't succeed, all the modern data acquisition would be wasted. Currently, the theoretical understanding of organisms has been pursued by building mathematical models and performing computer simulations. In the future, computers or artificial intelligence will predict the mathematical models from the large-scale experimental data. This type of approach is referred to as a data-driven biology. Onami believes this is the future.
(Illustration by Yoko Sugeno)
- Kyoda K, Tohsato Y, Ho KH, & Onami S (2014) Biological Dynamics Markup Language (BDML): an open format for representing quantitative biological dynamics data.Bioinformatics, 31(7),1044-1052 doi:
10.1093/ bioinformatics/ btu767