|
VI. Abstraction of General Principles
Throughout the course of our circadian clock studies, we unexpectedly noticed that certain principles are inherent in the dynamics and evolution of biological networks. In the following section, we deal with such kinds of general principles of biological networks as byproducts of our circadian clock studies.
VI-1. Principles in Dynamics and Evolution of Biological Networks
Recent analysis of the large-scale organization of gene expression has revealed its complex nature. The underlying dynamics that generate complex gene expression, however, are yet to be fully understood. To comprehensively and quantitatively elucidate these underlying gene expression dynamics, we first analyzed genome-wide gene expression under several experimental conditions in Escherichia coli, Saccharomyces cerevisiae, Arabidopsis thaliana, Drosophila melanogaster, Mus musculus and Homo sapiens. We were able to demonstrate that gene expression dynamics follows the same and surprisingly simple principle from bacteria to human; where gene expression changes are proportional to their expression levels, and show that this "proportional" dynamics or "rich-travel-more" mechanism can regenerate the observed complex and dynamic organization of the transcriptome (Fig. 3-VI-1) (Ueda H.R. et al, 2004, PNAS).
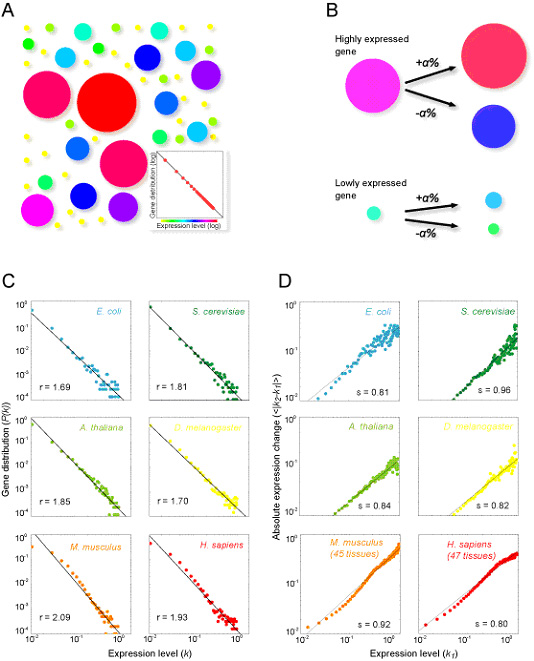
Figure. 3-VI-1 (A) Distribution of gene expression levels. The size and color of each disk represent the level of gene expression. As the distribution obeys the power law distribution (inset), there are fewer large disks (highly expressed gene) than small disks. (B) Principal dynamics which make the power law distribution. Expression level of a highly expressed gene changes more than that of a lower expressed gene, but the ratio of the change is constant (α). (C) Evolutional Conservation of Transcriptional Organization. The distributions of gene expression levels in Escherichia coli, Saccharomyces cerevisiae, Arabidopsis thaliana, Drosophila melanogaster, Mus musculus and Homo sapiens exhibit a power-law distribution in which the probability that a gene has an expression level k, decays as a power law, P(k)~k-r A straight line in each panel represents the estimated power-law distribution. The estimated value of exponent r is indicated in the lower left hand corner of each panel. (D) Proportionality in gene expression dynamics. The absolute expression level change (|ΔK|≡|k2-k1|) is plotted along the before-transition expression level in Escherichia coli, Saccharomyces cerevisiae, Arabidopsis thaliana, heads of Drosophila melanogaster, 45 tissues of Mus musculus and 47 tissues of Homo sapiens expression data. The estimated values for exponents from a log-log plot of absolute expression change against the before-transition expression level (i.e. |ΔK|~K1s) are indicated in the lower right hand corner of each panel.
We found that this "rich-travel-more" mechanism is also observed in metabolic networks through evolution. The previous analysis of the large-scale cellular organization has revealed the scale-free nature and robustness of metabolic and protein networks. We have analyzed the evolution of metabolic networks of 126 organisms, whose draft or complete genome sequences have been published. This analysis has revealed that the evolutional process of metabolic networks follows the general and surprisingly simple principle in Archaea, Bacteria, and Eukaryotes; where highly linked metabolites change their chemical links more dynamically than less linked metabolites. We demonstrate that this "rich-travel-more" mechanism can generate the observed scale-free organization of metabolic networks (Fig. 3-VI-2)(Ueda H.R. et al, submitted). These findings illustrate a universal principle in the evolutional process of metabolic networks. These results suggest the unexpected similarity between metabolic evolution and gene expression dynamics and marked flexibility of gene expression and metabolic network through evolution.
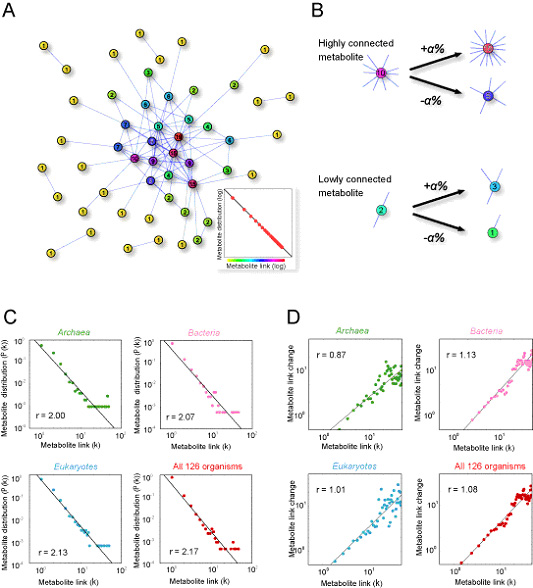
Figure. 3-VI-2 (A) Network with power law. Each node and link represents metabolites and their link, respectively. As the link number of each node obeys the power law distribution (inset), there are fewer highly connected nodes than lowly connected nodes. The number displayed in each node is the number of links associated with the node. (B) Principal dynamics which make the power-law distribution. Link number of a highly connected metabolite changes more than that of a lowly connected metabolite, but the ratio of the change is constant (α%). (C, D) Universality and flexibility observed in evolution of metabolic networks from Archaea, Bacteria, to Eukaryotes. (C) Evolutional conservation in the large-scale organization of metabolic networks. The distributions of metabolite link in Archaea, Bacteria, Eukaryotes and all 126 organisms exhibit a power-law distribution in which the probability that a metabolite has k links to other metabolites, decays as a power law, P(k)~k-r, Straight line in each panel represents the estimated power-law distribution. Estimated value of exponent r is indicated. (D) Proportionality in Evolution of Metabolic Networks. The absolute link change is plotted along the before-transition link level in Archaea, Bacteria, Eukaryotes and all 126 organisms. Estimated values of exponents from log-log plot of absolute link change against the before-transition link level (i.e. |Δk|~k1r) are indicated.
|
| Page Top |