|
V. Medical Applications
In addition to circadian clock-related disorders such as sleep disorders or jet-lag syndrome a number of mental diseases, such as bipolar disorder, are reported as being affected by and associated with the circadian clock system. This means our scientific findings related to the circadian clock might be able to shed new light on some of these problems. As a first step towards clinical application, here we report on the development of a new detection method for body time.
V-1. Detection of Body-time: Molecular-timetable Methods
It has been suggested that drug administration at the appropriate individual's body time (BT) can improve the outcome of pharmacotherapy by maximizing potency and minimizing the toxicity of the drug, whereas drug administration at an inappropriate BT can induce severe side effects. Although a BT-dependent clinical approach known as "chronotherapy" has proved to be effective and important, its clinical use has been obstructed by the lack of clinically applicable methods for BT detection. For detection of individual BT via a single-time-point assay, we have proposed a new detection method that utilizes the standard timetable of multiple molecules and their single-time-point data (see this method's concept, Fig. 3-V-1-1 A). The method is a specific, sensitive, and accurate method for the detection of BT and rhythm disorders described as follows (Ueda H.R. et al., 2004, PNAS).
As the proof of concept for this molecular-timetable method, we utilized the gene expression data for the standard timetable and single-time-point data of multiple molecules. For constructing the standard timetable of multiple molecules, we first selected time-indicating genes, whose expression can reflect the internal body clock state, from genome-wide expression data-sets of mice liver collected every 4 hours over 2 days under light-dark (LD) or constant dark (DD) conditions. Here we use the term zeitgeber time (ZT) and circadian time (CT) where ZT12 is set to the onset of the dark under LD and CT12 is set to the beginning of the behavior under DD conditions. We selected 168 genes (182 probe-sets) through two successive statistical filters; cosign fitting filter for clear circadian periodicity, and high coefficient variance (standard deviation / mean value) for good amplitude. Peak times of time-indicating genes ("molecular peak time") are distributed over a 24 hour period, and the molecular peak time of each gene under LD and DD conditions are similar to each other (Fig. 3-V-1-1 B). If we look these genes expression profile at one time point (e.g., the beginning of day (ZT0) or subjective day (CT0)), dawn-indicating genes, whose expression peaks are nearly at ZT/CT0, are highly expressed, whereas dusk-indicating genes, whose expression peaks are nearly at ZT/CT12, are expressed at a low level. Genes whose expression peaks are distributed between these two are expressed gradually and change from higher to lower along their molecular peak times (Fig. 3-V-1-1 C). Such gradual and cyclic changes in expression along the molecular peak time line allow us to extract the BT from the expression profiles via cosine curve fitting. The peak of the best-fitted cosine curve to an expression profile of 168 time-indicating genes indicates the estimated BT. We termed this "the molecular-timetable method." By this method, BT information can be extracted from the expression profiles of 168 time-indicating genes with high accuracy and estimation errors (defined as the difference between estimated BT and true BT) from 0.0 to 1.3 h (0.4 ± 0.3 h for mean ± SD).
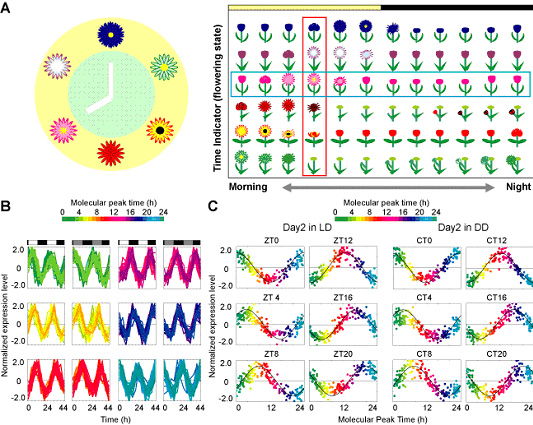
Figure. 3-V-1-1 (A) Schematic view of time detection. The state of each flower tell us the time. If we select the fully blossomed one, we can make a flower clock like the left panel. Although observing one flower state we may succeed in getting the time information (e.g. the pink one indicated by blue rectangle on the right panel), but the accuracy of the information remains very low. By comparing flower states whose blooming times are different to each other, we can obtain more precise time information (red rectangle). (B) Temporal expression data of 168 time-indicating genes (182 probes) in the mouse liver. The colors, in ascending order from green to red to blue, represent the molecular peak time of time-indicating genes (the color code is represented above the diagrams). The expression level of each time-indicating gene is subtracted by its average and divided by its SD over a 12-point time course. The blocked horizontal bars below the diagrams correspond to the LD schedule. White blocks indicate periods of exposure to light, whereas black blocks correspond to periods of darkness, and gray blocks indicate the period of subjective day under constant darkness. (C) Expression profiles of 168 time-indicating genes in the mouse liver at different ZT under LD conditions or CT under DD conditions. The best-fitted cosine curve is represented, and its peak indicates the estimated BT.
The molecular-timetable method can be applied both for BT detection and for the detection of circadian rhythm disorders. To demonstrate the capability of this molecular-timetable method, we attempted to infer BT from independent samples. We obtained liver samples from four individual mice at ZT12 (beginning of the night), the time thought to be one of the noisiest time points, and measured the expression profiles of 168 time-indicating genes. Using the molecular-timetable method, we detected BT with estimation errors from 0.3 to 1.8 h (1.0 ± 0.6 h for mean ± SD, Fig. 3-V-1-2 A). BT can be accurately inferred from expression profiles at time points that were not used to construct the molecular timetable (ZT6, ZT18, CT6, and CT18) with estimation errors from 0.3 to 2.0h (1.1 ± 0.7 h for mean ± SD, Fig. 3-V-1-2 B). To demonstrate the feasibility of expression-based diagnosis of circadian rhythm disorders, we sampled livers at ZT12 from four individual Clock/Clock homozygous mutant mice, which were known to have altered circadian behavioral rhythms (Fig. 3-V-1-2 C upper panels). By measuring the expression profiles of 168 time-indicating genes, we significantly detected the rhythm disorders in all expression profiles of Clock/Clock homozygous mutant samples at ZT12 (Fig. 3-V-1-2 C lower panel).
In clinical situations, the methods involved in BT detection should be applicable to populations with heterogeneous genetic backgrounds. To demonstrate the capability of the molecular-timetable method for individuals with heterogeneous genetic backgrounds, we attempted to apply the molecular-timetable method for other inbred strains with different genetic backgrounds from the original strain (Balb/c) used for the construction of the molecular timetable. We sampled livers at ZT12 from three individual C3H strain mice, and measured expression profiles for 168 time-indicating genes. We significantly detected circadian rhythmicity in all expression profiles of the C3H samples and found that the estimated BT indicated BT12.3, BT11.3, and BT11.3, respectively (Fig. 3-V-1-2 D). These results suggest that BT can be accurately inferred from the expression profiles of individuals with heterogeneous genetic backgrounds, with estimation errors from 0.3 to 0.7 h.
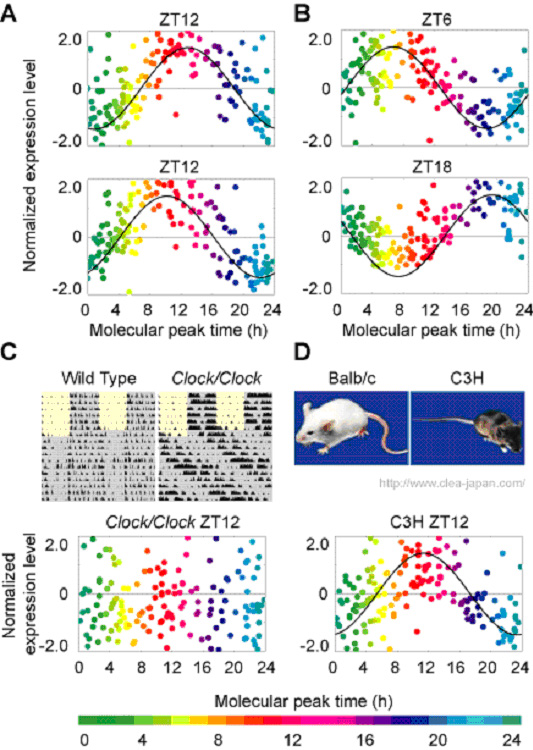
Figure. 3-V-1-2 (A-B) Significant and quantitative detection of BT (Balb/c) from individual expression profiles at ZT12 (A), ZT6 or ZT18 (B). The colors, in ascending order from green to red to blue, represent the molecular peak time of time-indicating genes. An expression level of each time-indicating gene is subtracted by its average and divided by its SD in the molecular timetable. The best-fitted cosine curve is represented, and its peak indicates the estimated BT; these are BT12.8 (A, upper panel), BT10.2 (A, lower), BT6.7 (B, upper), and BT19.3 (B, lower). (C-D) Significant detection of BT and rhythm disorders from expression profiles of Clock/Clock mutant mouse at ZT12 (C) and C3H mouse at ZT12 (D). As shown in actograms (C, upper panels), the Clock/Clock mutant mouse shows a relatively long period of behavioral rhythm compared to the wild type. We were unable to detect BT from Clock/Clock mouse (C) whereas we could detect BT of C3H strain mouse with an estimated BT of 12.3 (D).
In this study, we devised a method for BT detection utilizing single-time-point data for multiple molecules. To elucidate the importance of the use of many time-indicating genes, we assessed the specificity, sensitivity, and estimation error of the molecular-timetable method with different numbers of time-indicating genes in the presence of measurement noise, which is inevitable in clinical situations. In the presence of 100% measurement noise, the application of the molecular-timetable method with 100 (or 150) time-indicating genes had the ability to detect the BT with >99.99% (99.99%) sensitivity (defined as the percent of control expression profiles higher than threshold of correlation in cosine curve fitting) and 99.99% (99.99%) specificity (defined as the percent of random expression profiles lower than threshold of correlation) and with low estimation errors 0.30±0.24 h (0.25±0.21 h). Even in the presence of 200% measurement noise, use of the molecular-timetable methods with 100 (or 150) time-indicating genes still had the capability of detecting BT with 98.58% (99.72%) sensitivity and 98.58% (99.72%) specificity and with low estimation errors 0.62±0.48 h (0.50±0.39 h). On the other hand, the molecular-timetable method with three (or five) time-indicating genes failed to specifically, sensitively, or accurately detect BT or rhythm disorders, suggesting the importance of the use of many time-indicating genes. The use of >100 time-indicating genes can confer high sensitivity, specificity, and accuracy to the molecular timetable, even in the presence of high measurement noise. Interestingly, we noted that the molecular-timetable method, with as few as 60 time-indicating genes, if selected appropriately can sensitively and accurately detect BT and sensitively diagnose rhythm disorders in real expression profiles. Adding to these results, we successfully carried out BT estimation using Drosophila heads samples (113 time-indicating genes, 0.4±0.4 h). We also succeeded in demonstrating its effectiveness by circadian rhythm disorder detection of dClock/dClock mutants. These results suggest that the molecular-timetable method can be applied in the detection of BT and circadian rhythm disorders in organisms other than mouse.
Collectively, we constructed a molecular timetable and devised a specific, sensitive and accurate method for detection of BT and rhythm disorders from a single-time-point expression profile using this molecular timetable. The power of the molecular-timetable method can be demonstrated by the quantitative and accurate detection of BT from individual expression profiles and the accurate detection of circadian rhythm disorders in Clock/Clock homozygous mutant mice. These results demonstrate the feasibility of BT detection based on single-time-point sampling, suggest the capacity for the expression-based diagnosis of circadian rhythm disorders, and may lead to the development of chronotherapy and personalized medicine.
|
| Page Top |