|
II. Analysis of the Clock
To derive the design principle of a system of interest, it is important to validate the behavior of a predicted system through an accurate measurement with several types of perturbations (System Analysis). Through our efforts to identify the circadian clock system, we have succeeded in drawing the circadian transcriptional circuits. Here we highlight the morning element, E-box, as its topological importance in the system. Aiming to reveal the design principle behind the circadian clock system, we perturbed the E-box function using a special technique, in vitro cycling assay system, and were able to observe the dynamic change of clock features. Through this study, we have demonstrated the necessity of transcriptional repression for maintenance of the circadian clock (Sato T.K., Yamada R.G., Ukai H. et al, 2006, Nature Genetics).
II-1. Negative Feedback: Heart of the Clock
Circadian clocks have been proposed as consisting of autoregulatory loops in which transcriptional feedback and regulated protein turnover are used to maintain a 24-hour periodicity. The universal necessity for transcriptional feedback repression, however, arose as a question mainly from recent studies about the cyanobacterial circadian rhythms in which the repression was shown to be not necessary. Circadian feedback repression in mammals is believed to be mediated by CRYPTOCHROME (CRY1, CRY2) and PERIOD (PER1 and PER2) proteins. CRY and PER proteins are hypothesized to autoregulate their own expression by repressing the heterodimeric complex of the basic helix-loop-helix (bHLH) PERARNT-SIM (PAS) domain transcriptional activators CLOCK and BMAL1, which bind to E-box elements in the CRY and PER promoters. However, direct evidence for the requirement of CRY-mediated repression of CLOCK/BMAL1 transcriptional activity in the maintenance of circadian clock function has yet to be presented. Here, in an ongoing joint study with the J.B. Hogenesch group (Scripps Research Institute, Florida) and the S.A. Kay group (Scripps Research Institute, California), we have successfully showed that the feedback repression is actually required for mammalian circadian clock function as reported in Nature Genetics (2006).
In order to determine the requirement of feedback repression in circadian clock function, we sought to identify the CLOCK alleles that were insensitive to CRY1 repression but maintained normal transcriptional activity. Our collaborative partners in Scripps Research Institute (Florida, United States) first generated a library of ~6,000 random point mutants of human alleles for both CLOCK and BMAL1. They screened clones individually in cell-based reporter assays with wild-type Bmal1 cDNA and a Per2 promoter-luciferase (PER2-Luc) construct in the presence of cotransfected Cry1. Of the CLOCK and BMAL1 clones screened, several clones reproducibly maintained threefold or greater reporter activity in the presence of CRY1 compared with wild-type alleles. Notably, these clones demonstrated similar transcriptional activities as wild-types in the absence of cotransfected Cry1, suggesting that these mutations do not cause overt alterations in the heterodimerization, nuclear localization, DNA binding and transactivation properties of the mutant CLOCK/BMAL1 complex.
The prevailing transcriptional feedback model (Fig. 3-II-1 A) predicts that impairment of CRY-mediated repression should have marked effects on circadian expression of the Per genes. This notion is supported by in vivo observations that expression of Per1 and Per2 is constitutively elevated in Cry1/Cry2 double knockout mice. To determine whether these mutations in CLOCK and BMAL1 cause phenotypic changes in circadian gene expression, we performed in vitro cycling assay (Section 3-I-1). Mouse NIH3T3 cells were transfected with plasmids harboring destabilized Luc (dLuc) driven by the Per2 or SV40 basic promoters along with the BMAL1 and CLOCK mutant alleles, and monitored using in vitro cycling assay (Fig. 3-II-1 B left). Cotransfection of wild-type CLOCK and BMAL1 did not substantially alter rhythmicity compared with empty vector transfection, as their period lengths were 21.4 ± 0.4. In contrast, when compared with wild-type CLOCK/BMAL1, transfection of either of CLOCK or BMAL1 mutant alleles resulted in substantial impairment of circadian rhythmicity after one or two cycles of oscillations. Notably, cotransfection of CRY-insensitive mutant CLOCK and BMAL1 together resulted in the loss of circadian Per2 promoter activity. We were therefore able to demonstrate that the transcriptional repression of CLOCK/BMAL1 by CRY was required for circadian E-box activity.
In addition to Per and Cry, the rhythmic expression of both Bmal1 mRNA is also under circadian clock regulation. The Bmal1 promoter used in this study, however, does not have E-box sites and instead contains RRE, whose activities are reciprocally controlled by the rhythmically expressed transcriptional repressor REVERBAα and activator RORα. As an additional test for circadian clock function, we examined the effects of mutant CLOCK and BMAL1 on rhythmic RRE activity by in vitro cycling assays with a BMAL1-dLuc reporter. Similar to the results with the PER2-dLuc reporter, transfection of single CLOCK or BMAL1 mutants resulted in the decreased amplitude of cycling of BMAL1-dLuc activity compared with wild-type CLOCK/BMAL1 transfection. Moreover, this decrease in cycling amplitude was further exacerbated upon cotransfection of the double mutant heterodimer (Fig. 3-II-1 B right). These results indicate that transcriptional repression of CLOCK/BMAL1 by CRY is also required for circadian BMAL1 expression through RRE, which is dependent upon transcriptional, translational and post-translational actions of endogenous cellular factors.
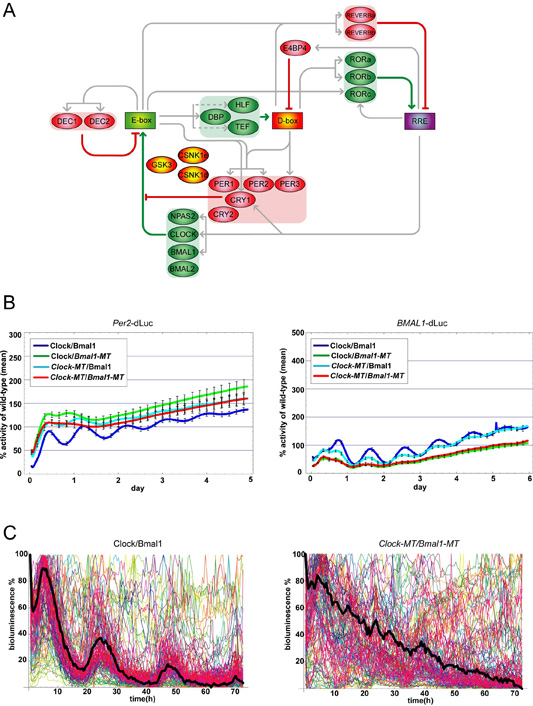
Figure 3-II-1 (A) Schematic representation of transcriptional network of mammalian circadian clock. Genes and CCE are depicted as ellipsoid and rectangle respectively. Transcriptional/translational expression, activation and repression are depicted as gray, green and red line respectively. (B) Coexpression of CLOCK/BMAL1 mutant heterodimers that are insensitive to CRY repression ablates circadian E-box and RRE activities in NIH3T3 cells. Plasmids expressing Flag-tagged CLOCK and BMAL1 alleles were transiently cotransfected with the Per2-dLuc reporter plasmid into NIH3T3 cells. (left panel) Per2 promoter activities in NIH3T3 cells transfected with single or double CRY1-insensitive CLOCK and BMAL1 mutants were monitored over 5 days. (right panel) BMAL1 promoter activities in NIH3T3 cells transfected with single or double CRY-insensitive mutants of CLOCK and BMAL1 were monitored over 6 days. All reporter activities were normalized such that the median wild-type luciferase activity over the time-course was 100%. (C) Coexpression of CLOCK/BMAL1 mutant heterodimers impairs circadian rhythmicity in individual cells. PER2-Luc reporter activities from individual NIH3T3 cells (n=133) transfected with Flag-tagged wild-type CLOCK/BMAL1 or double-mutant CLOCK-MT/BMAL1-MT were monitored over 3 days. Reporter activities from each wild-type or double-mutant cells were normalized such that the maximum bioluminescence value was set to 100% for each panel. The mean reporter activity for all analyzed single cells at each time point is indicated by a black line.
Arrhythmic Per2 expression seen from a population of cells expressing the double mutant CLOCK/BMAL1 complex may be due to the disruption of oscillator function or a lack of synchrony between individual rhythmic cells. In order to address these possibilities, we measured quantitative imaging of PER2-dLuc reporter activity from individual NIH3T3 cells by an approach similar to that used in analyzing BMAL1 reporter rhythms from single cells. As with the whole-well assays, the median reporter activity for the population of imaged individual cells coexpressing wild-type CLOCK/BMAL1 oscillated rhythmically (Fig. 3-II-1 C left). In contrast, the population of individual Clock/Bmal1 mutant cells (Fig. 3-II-1 C right) was visibly arrhythmic. Individual reporter activities from single wild-type cells were rhythmic, as expected, whereas individual Clock/Bmal1 double mutant cells showed arrhythmic reporter activities. These differences in activity patterns were evaluated by two independent statistical methods that score the circadian rhythmicity of experimental time-course data.
This is the first study that shows functional necessity for feedback repression in the mammalian circadian clock. Proof of this necessity is important, as recent studies of the cyanobacterial clock found that circadian oscillations in protein phosphorylation can be maintained in the absence of transcriptional feedback repression in vivo and with purified proteins in vitro. We therefore sought to formally test the requirement of CRY-mediated transcriptional feedback repression in the mammalian circadian clock by developing and implementing a new, unbiased cellular genetics approach that uses robust mutagenesis techniques and mammalian cell-based screening. Our data presented here provides direct evidence that CRY-mediated feedback repression of the CLOCK/BMAL1 complex is required for mammalian clock function. Although it is likely that the mammalian clock is governed by a combination of both transcriptional and nontranscriptional feedback mechanisms, any residual circadian properties that remain upon uncoupling of transcriptional feedback are insufficient to maintain circadian transcriptional output and molecular clock function. Finally, we predict that the application of cellular genetics technology will have a significant impact on mammalian biology as similar approaches have had on prokaryotic and yeast biology.
III. Control of Clocks
System control aims to regulate the target system toward the desired state through the precise perturbation of its components. To achieve this, it is necessary to develop an assay system which can be controlled with dynamic and quantitative perturbation.
The circadian clock is known to be entrainable by external cues such as light. The light information is transmitted to the circadian clock through sensing mechanisms containing photoreceptors, and as a result of light pulse, the clock system shows a drastic change of its dynamics. In this section, we show the success of control of the oscillating clock system in individual cultured cells via artificial light sensing mechanisms. We also applied this photo-perturbation system to one of the longstanding and unsolved biological phenomena known as the singularity behavior of circadian clocks.
III-1. Photic Control of the circadian Clocks:
Singularity Behaviors
Various stimuli are known to be triggers involved in directing the reset of mammalian cellular clocks (Akashi M. & Nishida E., 2000, Genes Dev, Balsalobre A. et al., 2000a, Science, Balsalobre A. et al., 1998, Cell , Balsalobre A. et al., 2000b, Curr Biol, Brown S.A. et al., 2002, Curr Biol, Hirota T. et al., 2002, J Biol Chem, Tsuchiya Y. et al., 2003, Genes Cells, Tsuchiya Y. et al., 2005, EMBO, Yagita K. & Okamura H., 2000, FEBS Lett, Yagita K. et al., 2001, Science). Unfortunately, it is difficult to control the circadian clock as freely using known stimuli such as temperature change. In contrast, photo-perturbation provides an ideal range of adjustability in timing and strength. Precisely adjustable perturbation is useful in elucidating questions related to dynamical properties of circadian clocks, especially the underlying mechanisms for singularity behavior of circadian clocks.
The singularity behavior of circadian clocks defined as the suppression of multi-cell-level circadian oscillation by critical perturbation is one of the intriguing dynamical properties of circadian rhythms. This behavior was first predicted theoretically as stopping oscillation of a limit cycle at an unstable fixed point (Winfree, A.T., 1970, J Theor Biol), and then experimentally observed in various organisms such as bacteria, fungus, fly, and human.
Despite frequent observation of the singularity behavior, its single-cell-level mechanism has not yet been elucidated, as the hierarchical structure of multiple cellular clocks underlies the organism-level circadian rhythm. Thus, all singularity behaviors have been observed at the multi-cell-level. The suppression of multi-cell-level oscillation might therefore be also attributed to the desynchronization of multiple oscillators by critical perturbation (Fig. 3-III-1-1). While this second possibility has been pointed out before (Winfree, A.T., 1975, Nature), the mechanisms for the suppression of multi-cell-level oscillation have yet to be completely verified.
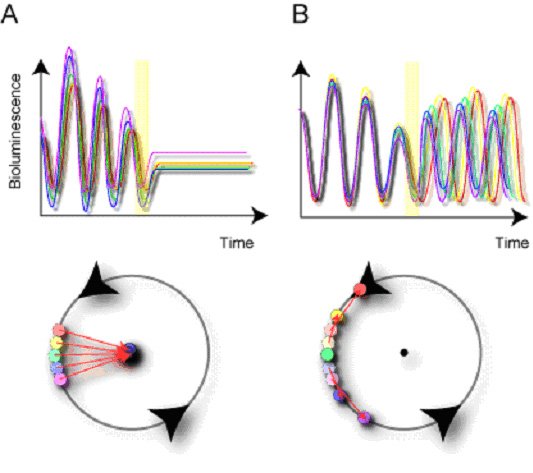
Figure. 3-III-1-1 Schematic diagrams of two alternative single-cell-level mechanisms for multi-cell-level singularity behavior. (A) arrhythmicity and (B) desynchronization of individual cellular clocks.
The in vitro light-responsible circadian system is indispensable for extracting the underlying mechanism of the singularity behavior behind the hierarchical structure of multi-cell organisms. To obtain such an in vitro system, we synthetically constructed light-responsible mammalian clock cells by exogenously introducing a photo-responsible receptor, Melanopsin (Fig. 3-III-1-2 A). Using a population-level luciferase (Luc)-reporter-assay, we verified that light-pulse can induce the shift of the phase and change of amplitude of the circadian oscillation in the cells depending on their intrinsic phases (Fig. 3-III-1-2 B, C).
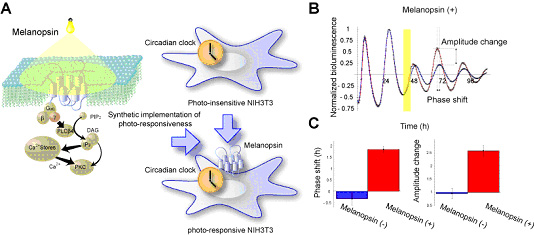
Figure. 3-III-1-2 Synthetic implementation of photo-responsiveness within mammalian clock cells. (A) Schematic representation of melanopsin-dependent photo-responsive NIH3T3 cells, and the known Gq signaling pathway. (B) Photo-responsiveness of multi-cell-level PER2-Luc reporter activities of melanopsin-positive and -negative cells. The multi-cell-level bioluminescence data from the cells with (red) and without (blue) light-pulse exposure is detrended and then normalized by the level of the last peak before the light pulse (yellow) for comparison. The phase shift (advance) and amplitude change (increase) of melanopsin-positive cells are induced by the light pulse. (C) Quantification of the phase shifts and the fold-changes in amplitude of the melanopsin-positive (red) and -negative (blue) cells induced by light pulse.
To search critical timing and strength that can induce population-level singularity, we systematically quantified the phase shifts and amplitude changes induced by light pulses of various timings and durations through high-throughput continuous monitoring of PER2-Luc reporter activity. We prepared twelve sets of melanopsin-positive and -negative cells, and then cells were exposed to light pulse of various timings and durations. As shown in Fig. 3-III-1-3 A, B, phase shifts induced by light pulses depended on the timing of light pulse. We then calculated multi-cell-level phase response curves (PRCs), where phase shifts are plotted against the timing of light pulses (Fig 3-III-1-3 B). The calculated PRCs for all tested durations show that the transition from phase advance to phase delay is around CT~6 (subjective noon), while the reverse transition is around CT~17 (near subjective midnight). Similar phase shifts were observed in BMAL1-Luc reporter activity (Data not shown), suggesting that melanopsin-dependent photo-perturbation can control the core components of mammalian circadian clocks. In addition to inducing phase shifts, light pulses can also increase or decrease the amplitude of PER2-Luc reporter activity (Fig. 3-III-1-3 C, D). We averaged the amplitude change over two days after the light pulse to quantify the multi-cell-level amplitude response curves (ARCs), where multi-cell-level amplitude changes are plotted against the timing of light pulses (Fig. 3-III-1-3 D). All ARCs are continuous, and the maxima and minima of ARCs are located around CT~6 (subjective noon) and CT~17 (near subjective midnight), respectively. Moreover, the maximum and minimum values of the ARCs depend on the light duration. Based on these results, we conclude that the phase and amplitude of mammalian cellular clocks can be adjustably and quantitatively controlled by melanopsin-dependent photo-perturbation.
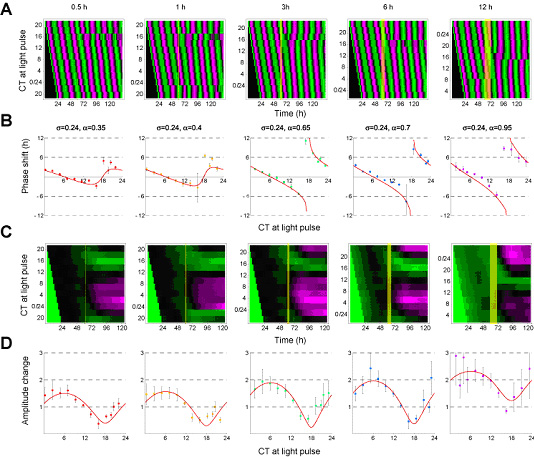
Figure. 3-III-1-3 Phase shift and amplitude changes of mammalian clocks induced by photo-perturbation. (A) High-throughput analysis of phase shifts of melanopsin-positive cells induced by light pulses (yellow) of various timings and durations. Magenta and green denote high and low normalized PER2-Luc reporter activities. (B) Phase response curves (PRCs) of the PER2-Luc reporter activities of melanopsin-positive cells against the timings of light pulses in circadian time (CT). The time of the forskolin stimulation was set to CT0. Forskolin was administrated to induce circadian oscillations in the cultured cells. Quantification of these phase response curves was measured at the multi-cell-level (i.e. the averaged behaviour of population of clock cells). (C) High-throughput analysis of fold-changes in amplitude of melanopsin-positive cells induced by light pulses (yellow) of various timings and durations. Magenta and green denote high and low normalized amplitudes of PER2-Luc reporter activities. The fold-change in amplitude is obtained by data processing of the original bioluminescence data. (D) Amplitude response curves of the PER2-Luc reporter activities of melanopsin-positive cells against the timings of light pulses in CT. These amplitude response curves are measured at the multi-cell-level (i.e. the averaged behaviour of population of clock cells).
From the ARCs, we found that a 3-hour light pulse applied at CT~17 significantly decreased the amplitude at multi-cell-level. We found this critical light pulse capable of driving cellular clocks into a singularity behavior where robust multi-cell-level PER2-Luc reporter activity can be abolished after the light pulse (Fig. 3-III-1-4 A). Since the circadian oscillation is recovered by a second light pulse applied about 3 days after the first one (Fig. 3-III-1-4 A), we confirmed that the clocks or cells themselves are not impaired, but only stopped transiently by the critical light pulse, suggesting this multi-cell-level singularity behavior holds the same properties as those already observed at multi-cell level in populations of unicellular organisms or multicellular organisms.
Our theoretical analysis consistently predicts that desynchronization of individual cellular clocks underlies this singularity (Data not shown). For direct verification of the two predictions, arrhythmicity or desynchronization at the single-cell level (Fig. 3-III-1-1), PER2-Luc reporter activity was measured in individual cells (Fig. 3-III-1-4). Phases of melanopsin-negative cells gradually diverge over time (Fig. 3-III-1-4 B left panel), which is consistent with the multi-cell-level decrease of the amplitude. In contrast, when melanopsin-positive cells are exposed to a critical light pulse capable of inducing the singularity behavior, the phases of cells are abruptly diversified by the light pulse (Fig. 3-III-1-4 B right panel), suggesting that the desynchronization was induced by the critical light pulse. To exclude the possibility that this diversification of phase might be due to arrhythmic behavior of individual cells, we tried to verify that the oscillation is regularly sustained after light pulse by arranging the order of cells according to the timing of the third peaks of individual cells (Fig. 3-III-1-4 C). We observed that the single-cell-level oscillations of melanopsin-positive cells were sustained after the light pulse, and that the onset of those single-cell-level oscillations is within one day after the light pulse for most of the individual cells, indicating that the observed singularity behavior cannot be attributed to the arrhythmicity of individual cells. In addition, we verified that the critical light pulse induced no significant changes in single-cell-level amplitude (Fig. 3-III-1-4 D), which excludes the possibility that the multi-cell-level amplitude decrease could be simply attributed to the single-cell-level amplitude decrease. Given these findings, we conclude that desynchronization of cellular clocks underlies the multi-cell-level singularity behavior. We also provide a theoretical framework to explain why singularity behaviors have been experimentally observed in various organisms, and propose desynchronization as a plausible mechanism for the observable singularity of circadian clocks (Ukai H., Kobayashi T.J.,et al, 2007 Nat Cell Biol).
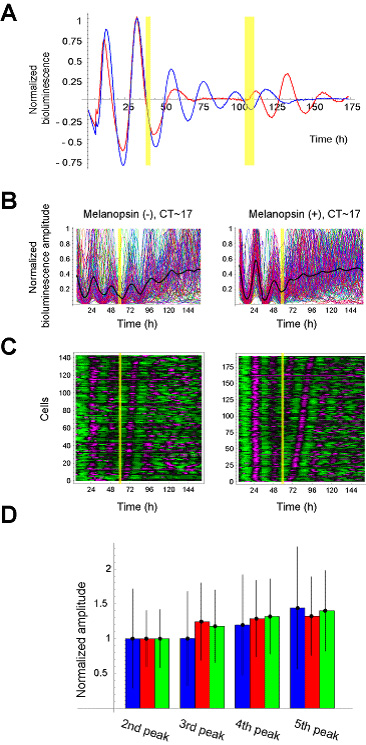
Figure. 3-III-1-4 Desynchronization Underlying the Singularity Behavior of Mammalian Clocks. (A) Singularity behavior of mammalian circadian clocks. Robust circadian rhythmicity of mammalian clocks is abolished after the first light pulse, and recovered by the second light pulse. The detrended and normalized PER2-Luc reporter activities of melanopsin-positive (red) and -negative (blue) cells are displayed with light pulses (yellow). (B) The normalized PER2-Luc reporter activities from individual cells with their averages (black thick lines). The timing of the light pulse (yellow) is designated in each panel. (C) The detrended and normalized PER2-Luc reporter activities from individual cells. Magenta and green denote high and low bioluminescence. The data is sorted by the timing of the third peaks. (D) Single-cell-level amplitude change. Average (filled bar) and standard deviation (error bar) of amplitude of 2nd, 3rd, 4th, and 5th peaks. The light-pulse has been applied between 2nd and 3rd peaks. Blue bars represent the amplitude of melanopsin negative cells. Red and green bars represent the amplitude of melanopsin positive cells after the light-pulses inducing desynchronization (red) and synchronization (green), respectively. The average amplitudes were normalized by those of the 2nd peak for comparison. The first peak right after the forskolin stimulation was omitted here because it might be affected by forskolin stimulation. Forskolin was administrated to induce circadian oscillations in the cultured fibroblasts.
To further extend our in vitro and in silico findings, we next investigated its in vivo relevance whether the desynchronization actually underlie the multi-cell-level amplitude decrease in mammalian central clocks (SCN) induced by critical light pulses. Expression of Per1 and Per2 genes in the SCN detected by in situ hybridization (Fig. 3-III-1-5 A) exhibit a remarkable multi-cell-level amplitude decrease after the critical light pulses (Fig. 3-III-1-5 B red lines). This multi-cell-level amplitude decrease in the SCN is correlated with the spatially desynchronized expression pattern of Per1 and Per2 within the SCN observed between dorsomedial (DM) and ventrolateral (VL) regions (Fig. 3-III-1-5 B green and blue lines). The observed spatial desynchronization was also verified more locally by using computer program that can automatically analyze the intensities of sequential SCN slice images at the pixel level (Fig. 3-III-1-5 C). Under the same experimental condition, we also confirmed that the critical light pulses can induce the temporal amplitude decrease of locomotor activity of rats (Fig. 3-III-1-5 D). These our in vivo observations supported our in vitro and in silico findings that desynchronization actually underlie the multi-cell-level amplitude decrease.
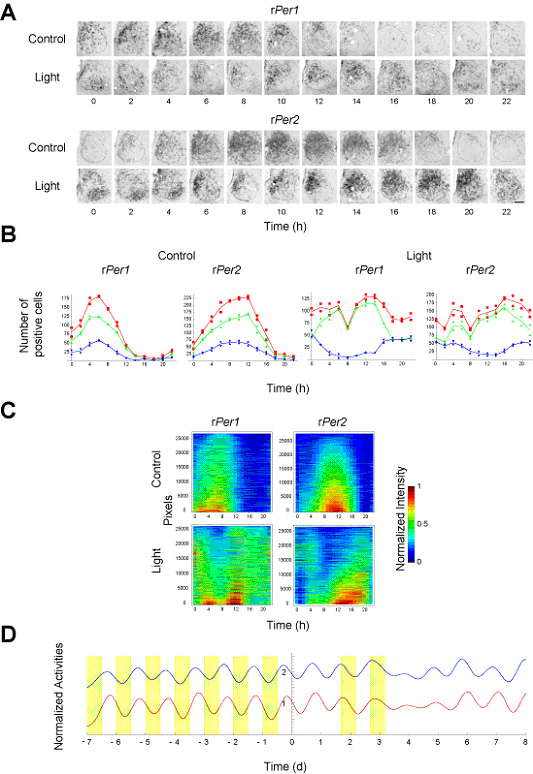
Figure. 3-III-1-5 Desynchronization underlying the multi-cell-level amplitude decrease in the rat suprachiasmatic nucleus (SCN) induced by the critical light pulses. (A) Spatio-temporal expression of Per1 and Per2 genes in the rat SCN examined by in situ hybridization using a digoxigenin-labelled Per1 and Per2 cRNA probes. Upper and lower panels indicate the expression of Per1 (upper) and Per2 (lower) genes in the SCN with (light) or without (control) the critical light pulses. The left side of each figure is the medial side of the SCN. Dashed lines indicate the SCN boundaries. The bar indicates 100 μm. (B) Number of positive cells in the entire SCN (red), dorsomedial (DM) region (green), and ventrolateral (VL) region (blue). Each point corresponds to data from one SCN sample, and the curves are the linear interpolations of the averages of two independent samples. (C) Time series of the normalized intensity of each pixel in the SCN images. The time series of pixels are sorted by their mean intensities so that higher mean intensity corresponds to lower index. (D) Time series of the locomotor activities of two independent rats whose showed substantial decrease in amplitude of locomotor activity one day after the critical light pulses. To extract long-term trend of locomotor activity, we applied moving average with 4-hour window size to the original locomotor activity data collected every 5 min.
Singularity behaviors have been widely observed in various organisms since the first report of such behavior in Drosophila pseudoobscura by Arthur T. Winfree in 1970. To elucidate the underlying mechanism, Arthur T. Winfree and others conducted the two-pulse experiment and revealed the "unclocklike" behavior of circadian clock, in which the critical light pulse inducing the singularity behavior seemed to decrease the amplitude of circadian clock without affecting its frequency, apparently arguing against both the simple limit-cycle model and its resulting prediction that the arrhythmicity would underlie the singularity behaviour. To explain this "unclocklike" behavior of circadian clock, he proposed the "clockshop" hypothesis, in which an organism-level circadian clock consists of multiple circadian oscillators with substantial fluctuations, and predicted that the desynchronization of individual circadian oscillators would underlie the singularity behavior (multi-cell-level amplitude decrease). He was unable to directly test this prediction, however, as there was no way to observe single-cell-level circadian rhythmicity at that time. In this study, his prediction on the desynchronization was directly proved at least in mammalian circadian system more than 30 years after he originally proposed it in his review.
|
| Page Top |